Carbon Intensity Indicator Dashboard

StormGeo’s Carbon Intensity Indicator (CII) Dashboard helps you comply with the CII rating scheme and navigate the path towards a sustainable future for shipping. Start improving your operational and environmental performance with reliable overviews and detailed guidance today.

StormGeo CII Dashboard

The importance of Carbon Intensity Indicator (CII)

Introduced by the International Maritime Organization (IMO), the Carbon Intensity Indicator (CII) rating scheme is an operational efficiency indicator that measures vessel carbon intensity over time. Cargo, RoPax, and cruise ships above 5000 GT are required to calculate and report the Carbon Intensity Indicator annually.

The CII scheme gives all vessels a rating from A to E based on reported IMO DCS data, and each ship needs a rating of C or better. Vessels that achieve a D rating for three consecutive years or an E rating in a single year need to develop an approved corrective action plan as part of the SEEMP. Otherwise, they risk becoming unattractive to the charter market or unable to trade internationally.

Key benefits

Calculate the CII properly

Calculate the CII and consider correction factors and voyage exclusions in accordance with CII guidelines by the IMO MEPC Correspondence Group.

Top-down approach

See the big picture and drill down to CII data details from the fleet to the vessel level.

Identify operational inefficiencies and monitor compliance

Get preliminary ratings and estimates on the year of deterioration with our CII Dashboard, and analyze the impact of operational measures with our CII simulator.

A reliable overview

Evaluate the operational performance of your fleet or ship affecting regulatory requirements.

Display the progression of the CII

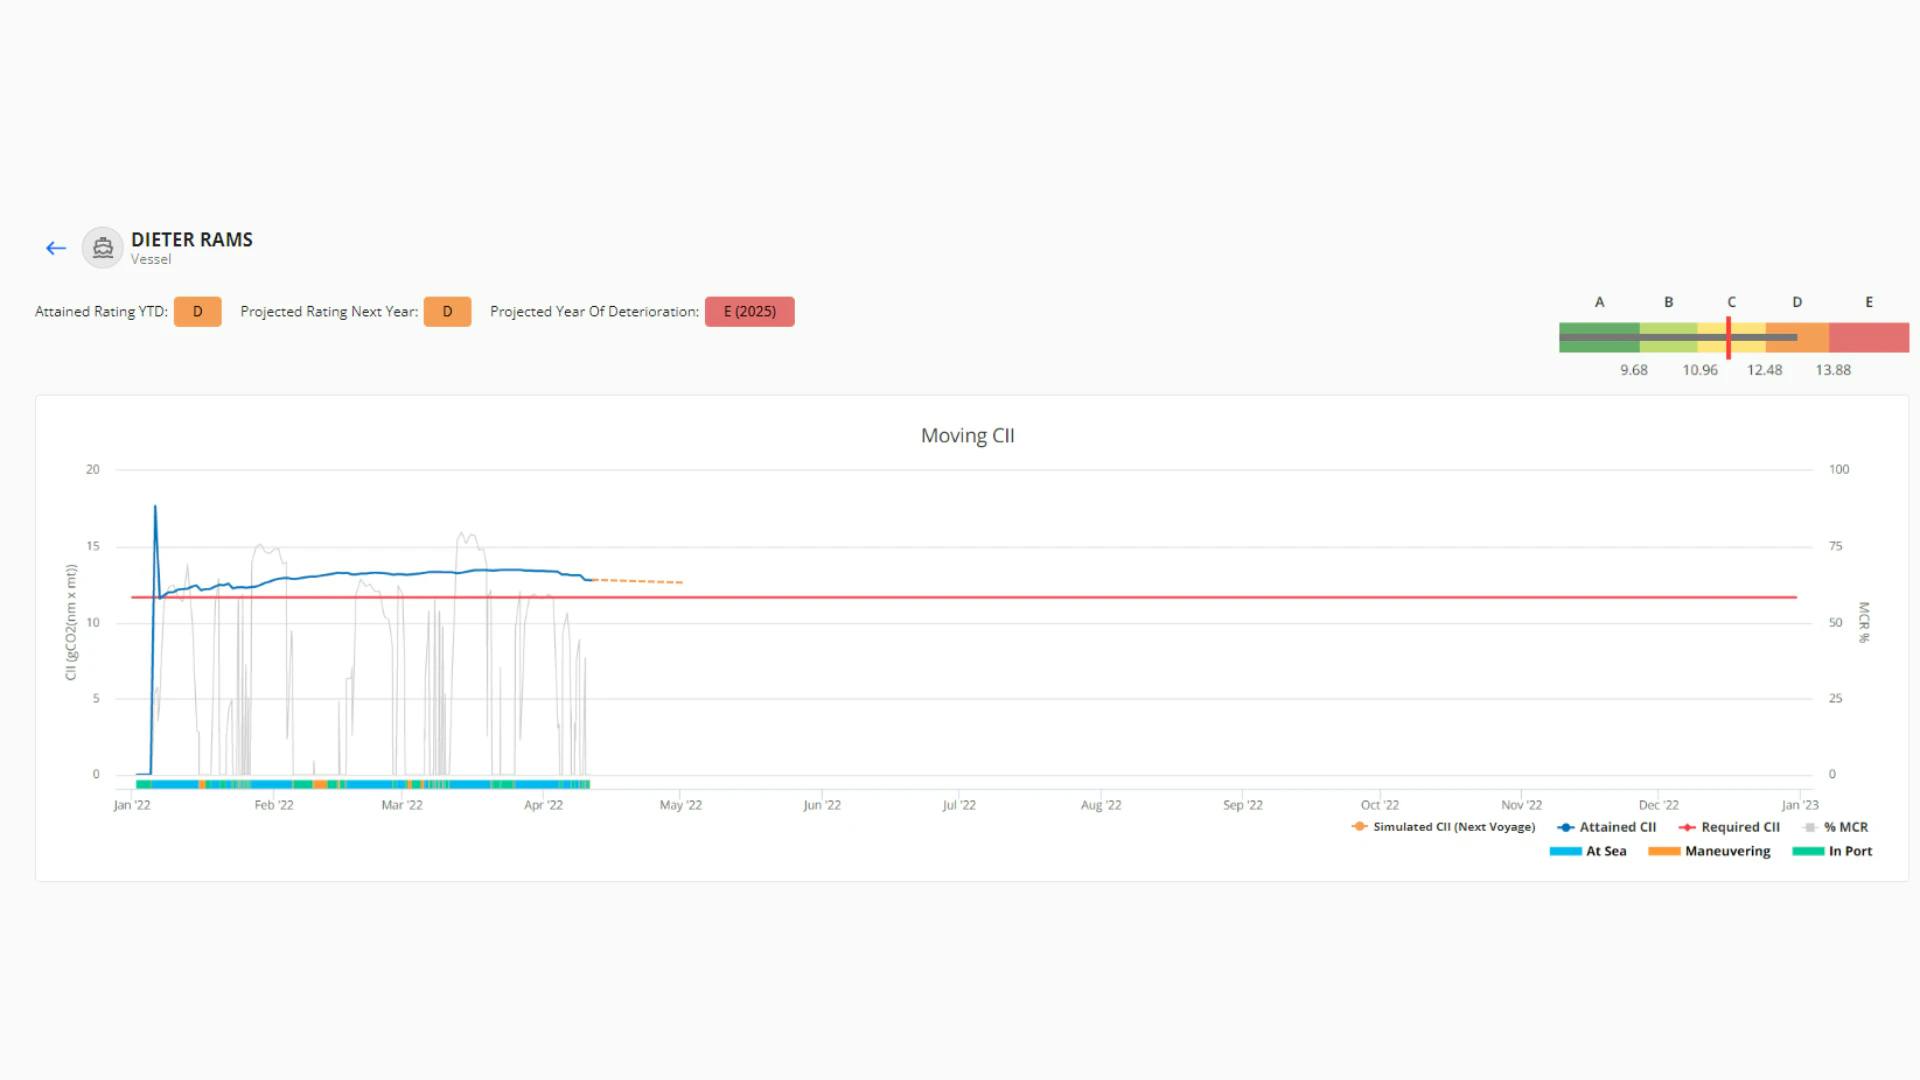
Monitor the progression of the CII over a period in relation to the required CII and proactively reveal operational inefficiencies. 

Export summary and detailed data

Share CII calculation data and ensure transparency with your fleet and stakeholders by easily exporting data summaries and detailed breakdowns.

Details & Specifications


CII Dashboard Specs

CII metrics at a glance

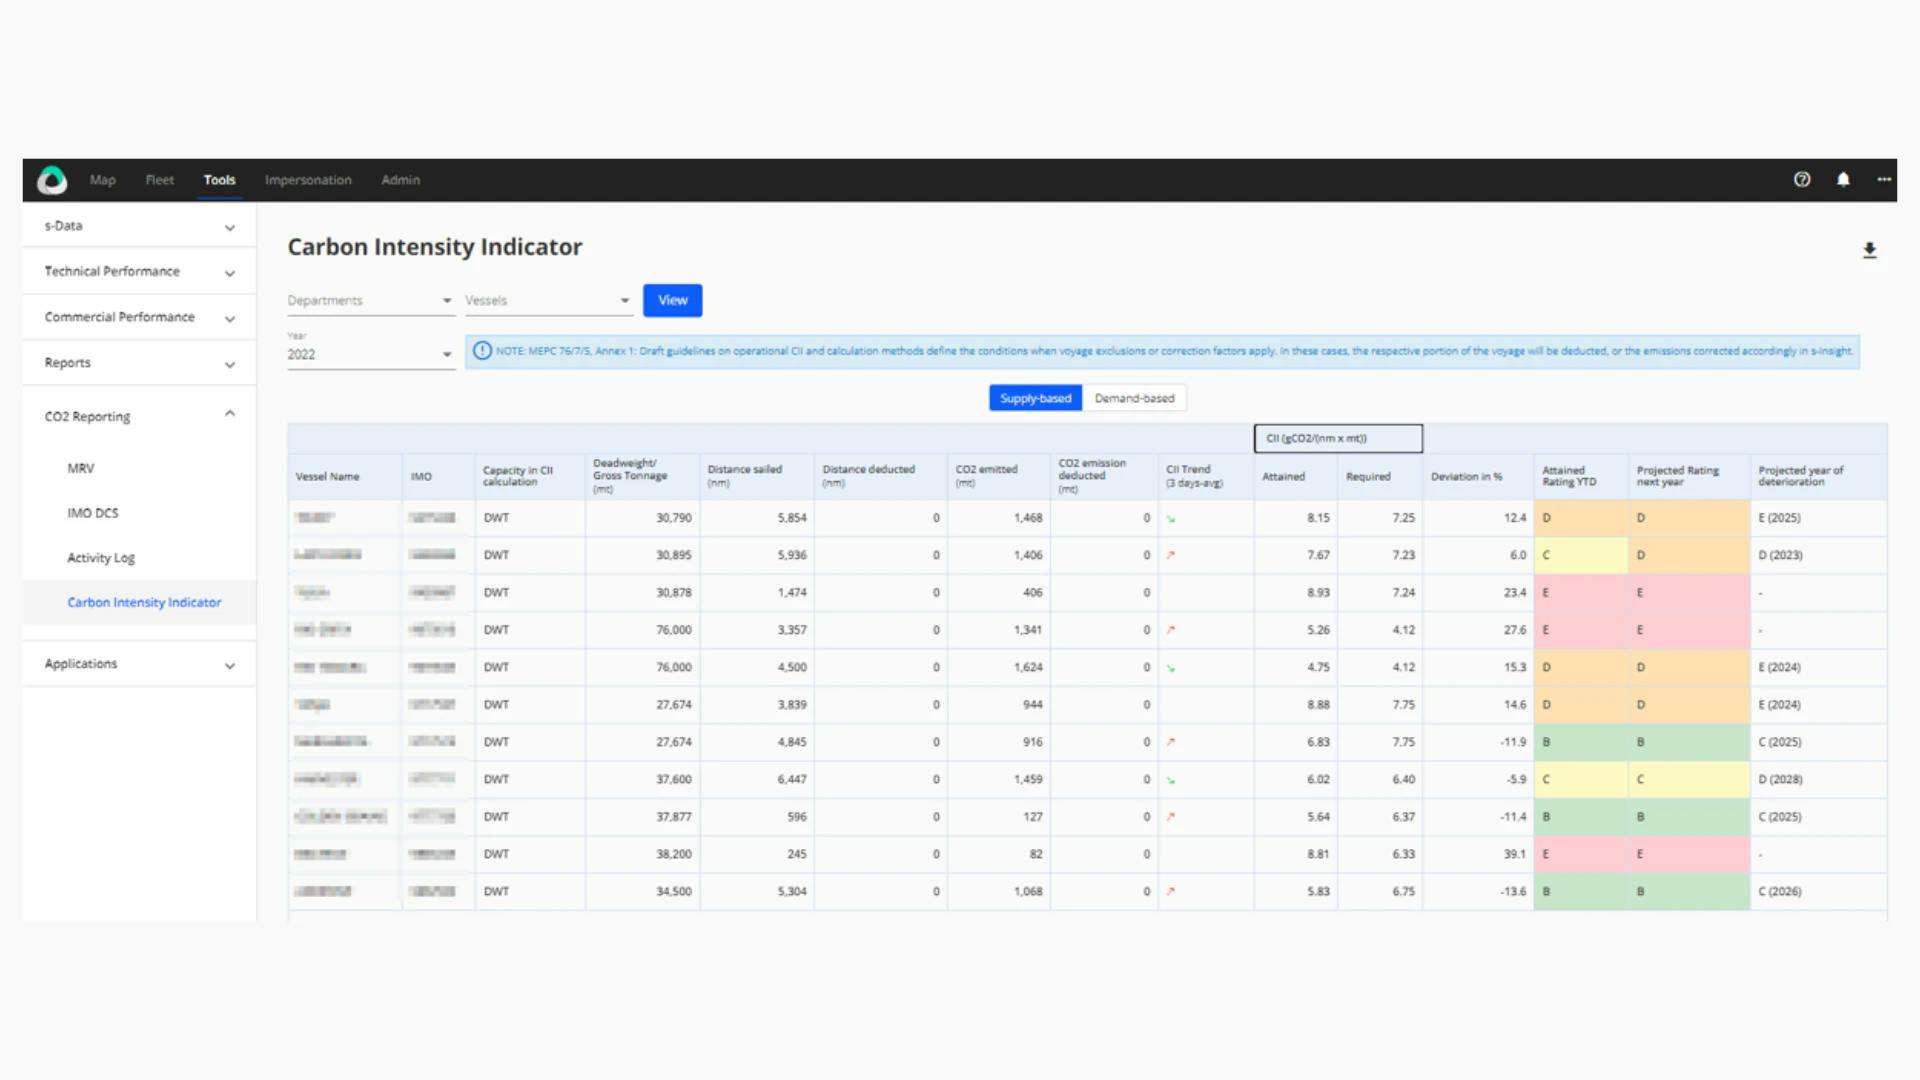
The CII Dashboard enables you to display all essential parameters in a tabular format:

  • Distance and CO2 emissions
  • Attained and required CII for the selected period
  • Deviation between attained and required CII
  • Preliminary ratings and predictions of the year of deterioration
StormGeo CII Dashboard with adjustment

Monitor CO2 emissions to reach decarbonization targets

Compare attained emission intensities to trajectories. The Carbon Intensity Indicator Dashboard supports all fuel types, including Biofuel consumptions expressed by a reported biofuel blend, and considers CO2 emission reduction factors when calculating CO2 emissions.

StormGeo CII Dashboard vessel filter

Filter for one or more vessel(s)

Identify and analyze CII data for relevant vessels by applying filters to select one or more vessel(s).

StormGeo CII Simulator Main screenshot

Project your CII rating

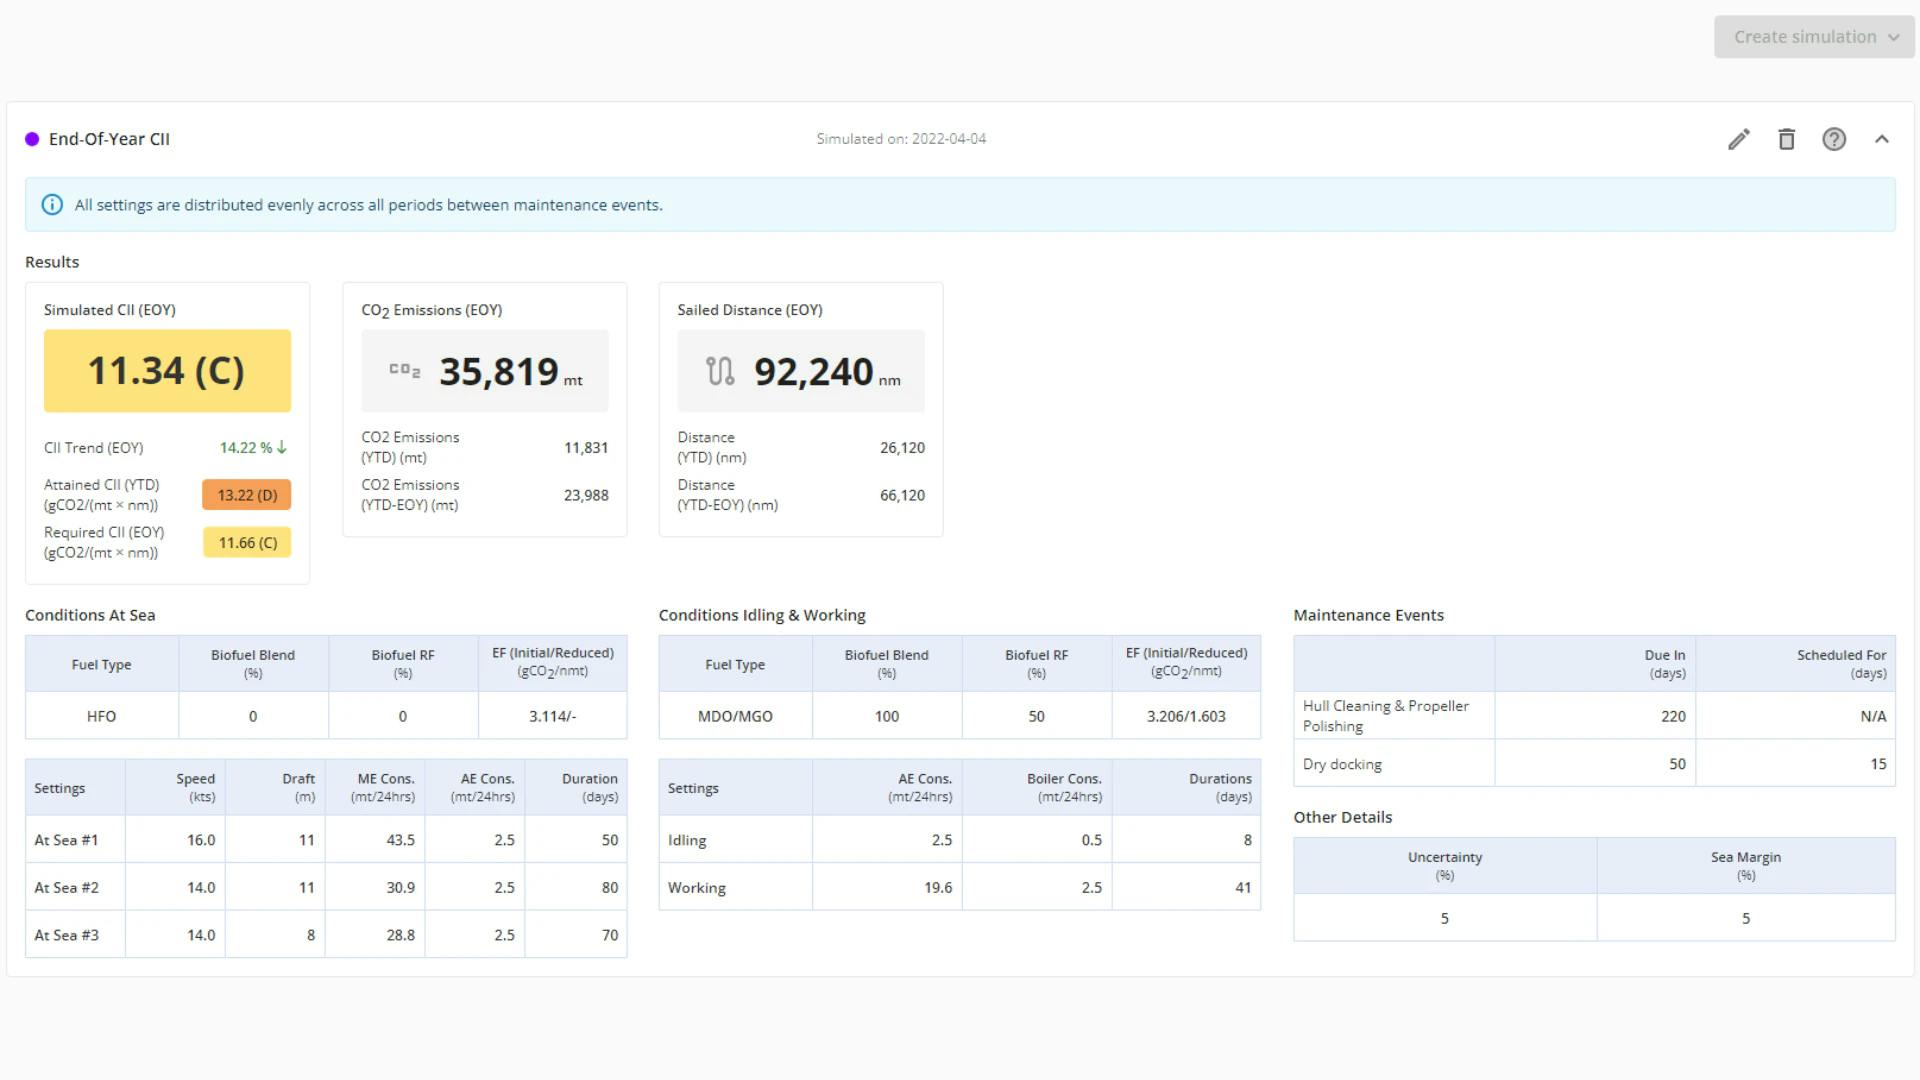
Compute and project the impact of commercial parameters on your CII rating. Our CII Simulator provides a flexible, powerful, and actionable tool for owners and operators to collaborate on operational deployment and achieve desirable CII ratings.

Click here to learn more about the CII Simulator.

Contact us to request a demo, or to speak with a StormGeo representative.

The full StormGeo s-Insight

s-Insight

s-Insight gives you the tools to manage the commercial, technical and environmental performance of your entire fleet. 

Work with StormGeo's world-leading Fleet Performance Center to validate and interpret your data throughout your voyage. Use our monthly/quarterly reports to see where you can cut costs and keep your fleet compliant. Or take advantage of our ad hoc investigation service.

Explore s-Insight